
Rain in Spain Writeup (Dawg CTF 2021)
Type: Misc
Difficulty: Medium
Prompt:
I installed this cool IoT-enabled weathervane on my boat for sailing around Málaga, but the sensors seem to be giving erratic readings...
Solution
Let’s open the given CSV with pandas and try to analyse the data.
import pandas as pd
import seaborn as sns

data = pd.read_csv("spain.csv")
data.info()
<class 'pandas.core.frame.DataFrame'>
RangeIndex: 3750 entries, 0 to 3749
Data columns (total 5 columns):
 #   Column        Non-Null Count  Dtype
---  ------        --------------  -----
 0   calendar_day  3750 non-null   int64
 1   temperature   3750 non-null   int64
 2   windspeed     3750 non-null   int64
 3   visibility    3750 non-null   int64
 4   uv_index      3750 non-null   int64
dtypes: int64(5)
memory usage: 146.6 KB
Plotting all the graphs to see if something useful is present.
sns.pairplot(data)

The plot between temperature and calendar_day looks like the flag.
sns.relplot(x=data['calendar_day'], y=data['temperature'])
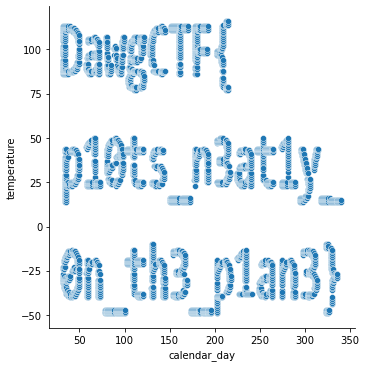
DawgCTF{p10ts_n3atqy_0n_th3_p1an3}